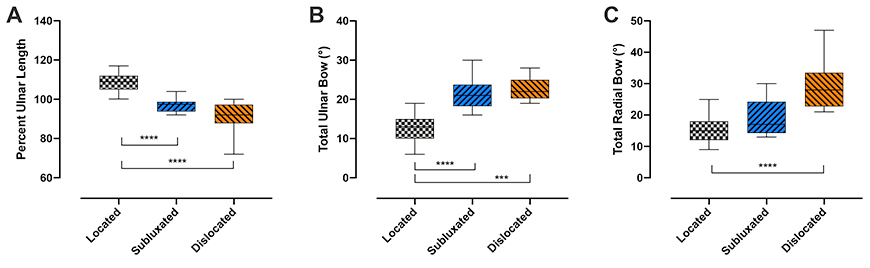
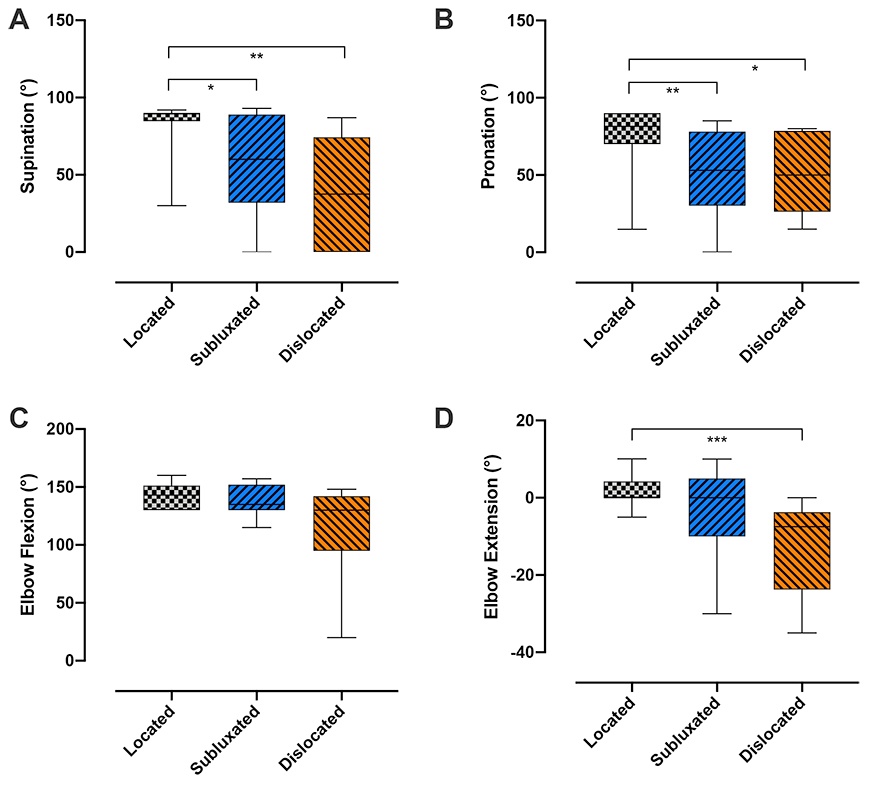
These two bar graph figures show the range of motion and radiographic differences between located, subluxated and dislocated groups.
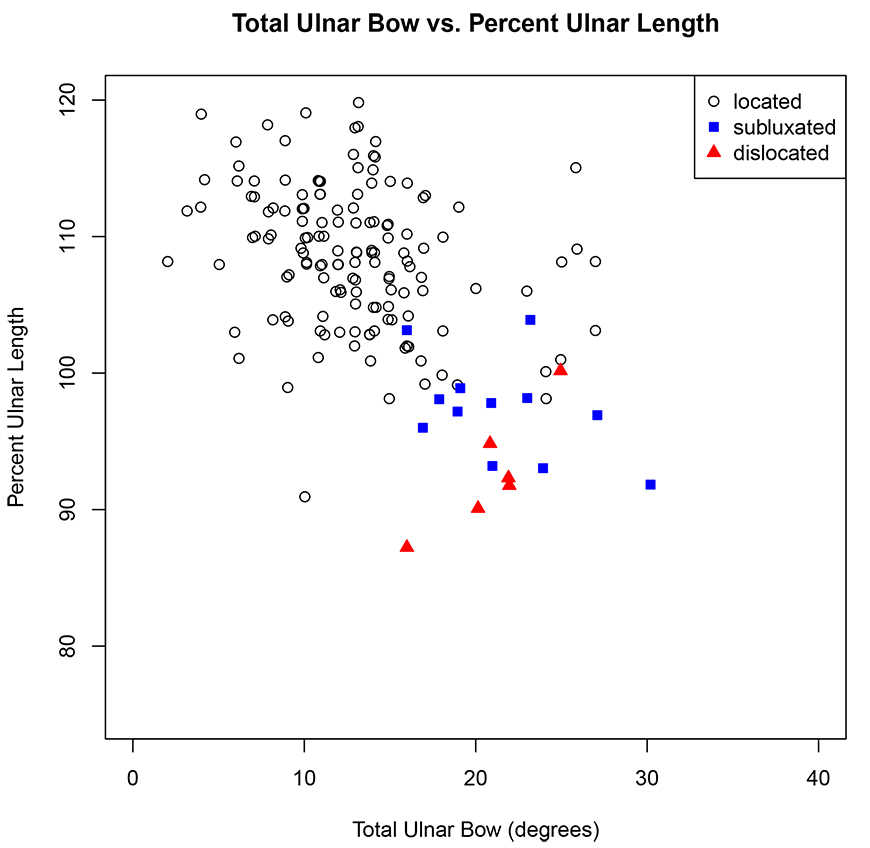
This scatterplot shows the relationship between total ulnar bow and percent ulnar length.
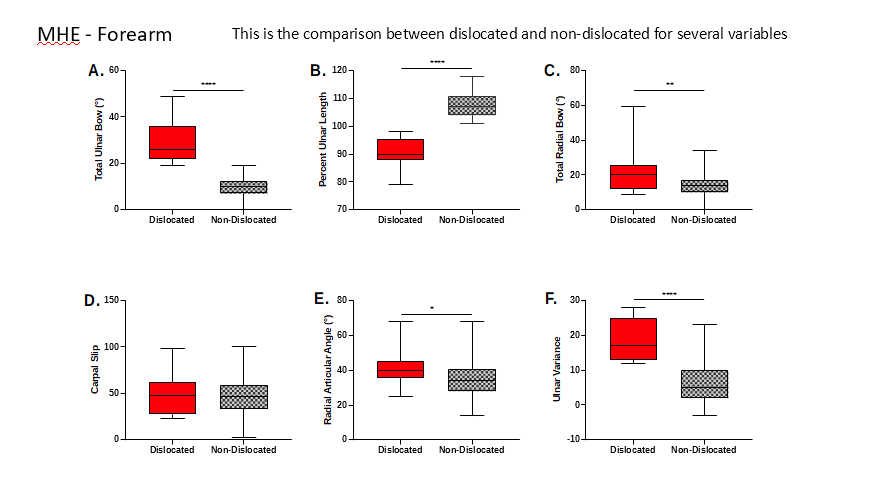
These charts demonstrate our data that maintain the radial head in joint in the elbow of MHE patients is predictable and dislocation can be avoided.
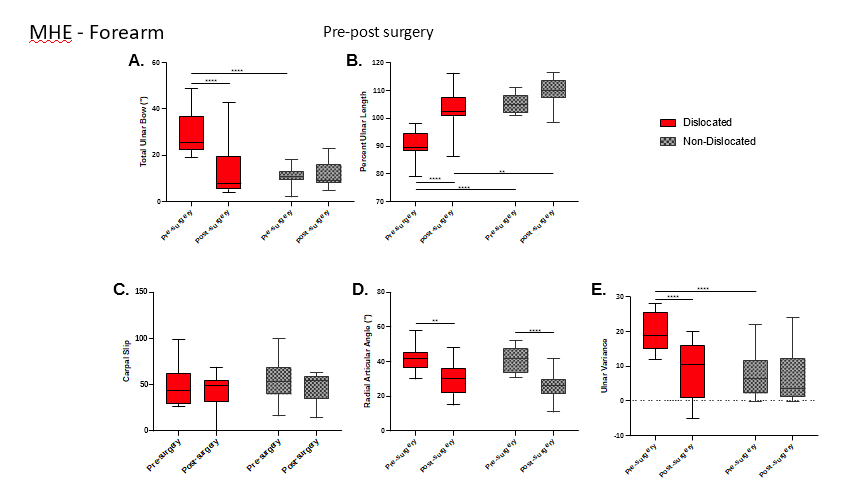
These charts demonstrate how surgical correction can prevent dislocation of the elbow in MHE patients.
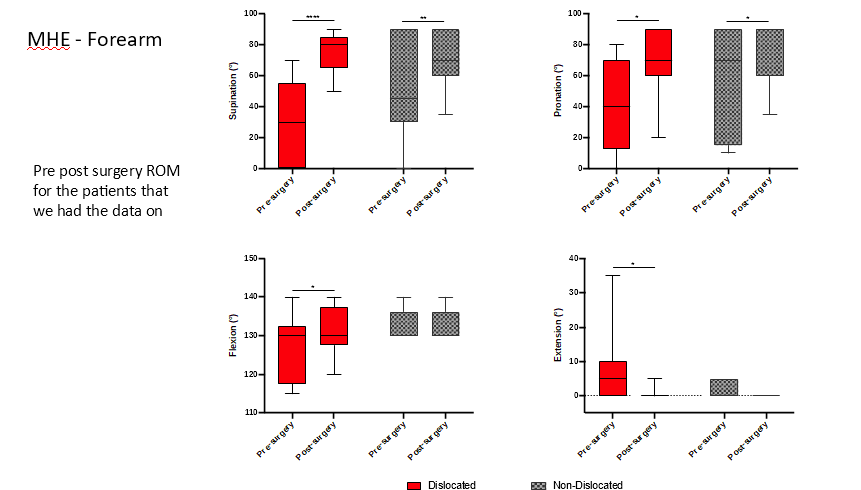
These charts demonstrate how improved range of motion can be achieved with surgery if we prevent dislocation in MHE elbows.
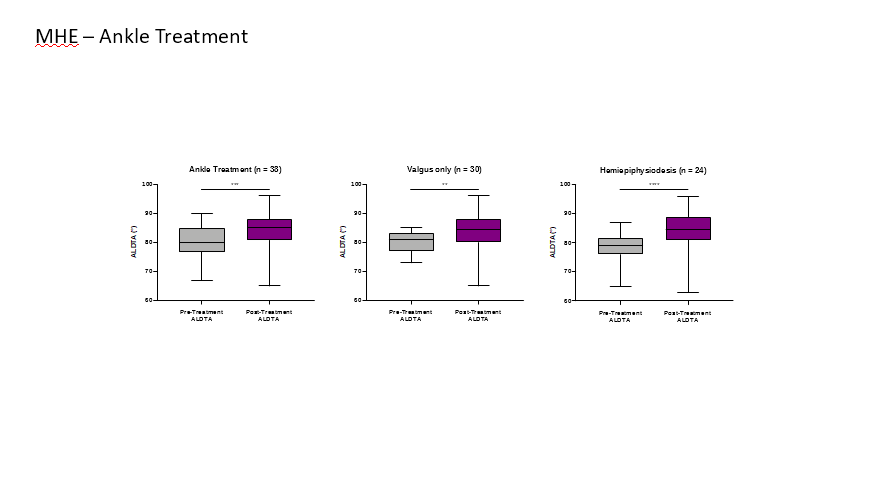
The chart demonstrates the ankle deformities seen in MHE.
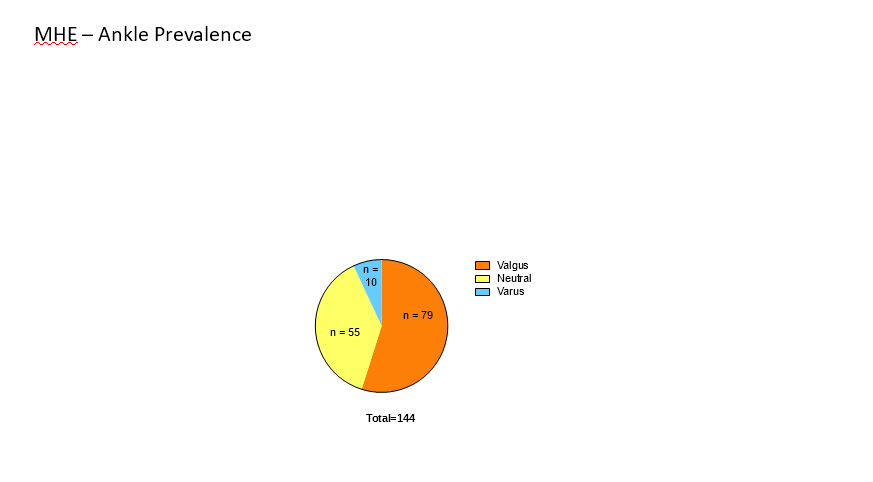
Fixing the ankle deformity in MHE is possible and achievable.